Tìm kiếm tập lệnh với "Buy sell"

Climatic Volume X- Climate volume detection
- Relative volume value in bar
- Automatic zone generation (possibility of configuration)
- Additional features
¡¡¡Thumbs up¡¡¡
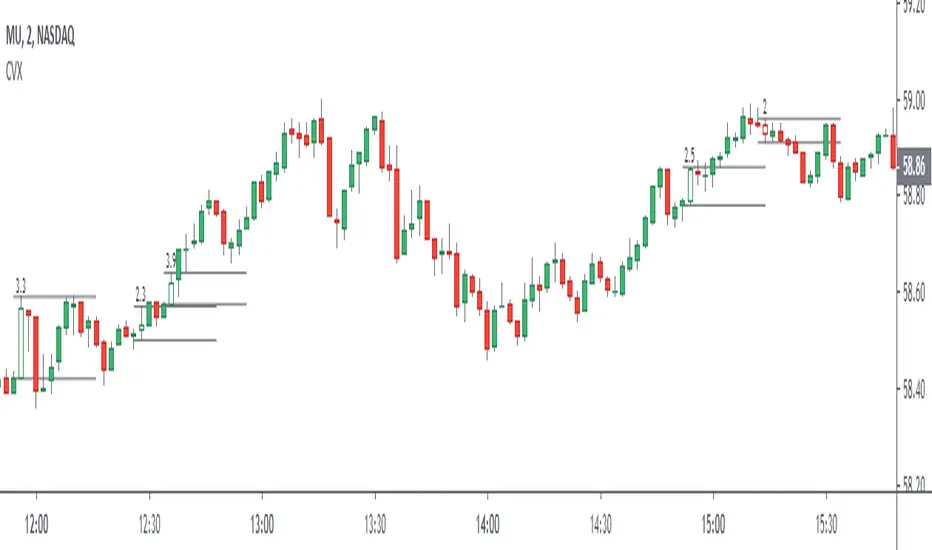
Elephant Bar by Oliver VelezThis script detects an event created by Oliver Velez, basically it is a wide-range candle, its range is noticeably larger than the previous candles, this event indicates a possible continuation of the movement, or the beginning of an extended movement. The candle has to be of good body, as a rule it can be taken that the body must be more than 70%. The stop goes below the minimum of the candle and the signal is given when the next candle followed by the elephant candle exceeds its body, this condition is not programmed so that the alert indicates that an elephant candle was generated and the trader has some time to visualize the graph and wait for the signal. Example below:
NOTE: IT IS VERY IMPORTANT THAT THE TRADER ANALYZE THE CONTEXT OF THE MARKET WHERE THE ELEPHANT BAR IS GENERATED AND DETERMINE ACCORDING TO ITS EXPERIENCE IF THE EVENT HAS A GOOD PROBABILITY OF PROJECTION, YOU MUST NOT TAKE AN ENTRY ONLY BY THIS EVENT, IF YOU DO YOU WILL LOSE ALL YOUR MONEY
.
One of the problems of the elephant bar is that it generates a fairly wide risk unit with respect to other narrow range events, so the risk / benefit ratio is not very large, but it is an event that deserves attention when it occurs in a good location since it generally generates continuation.
If you want to have a lower risk unit and improve the risk / benefit ratio, you can play the “Gift Zone”, when detecting an elephant bar you can wait for a step back inside the elephant bar area and take a position, this will give you a less distance to the stop, but this can lead to the event escaping if there is no recoil.
- The size of the candle is determined by comparing a range of previous candles (you can set the amount at your discretion)
- Search factor: by default 1.3, this means that all bars that have a range greater than the average range of previous candles + 30%, are considered elephant candles (can be configured at your discretion)
- Possibility to configure the percentage of the body that the elephant candle must have.
- Possibility of filtering up to 2 means with direction detection and color change (fully configurable)
- Possibility of filtering by mobile averages
- Alerts
- Additional features
Thumb up if you liked me ..

Histogram Trends Strategy by SedkurThis gives to you buy-sell signal with MACD's histogram trends.
Use "Fast and Slow length" and "Trend of Histogram Number" inputs to take less or more signal.
"Trend of Histogram Number" : This means how many histogram bars the trend continues before trading.

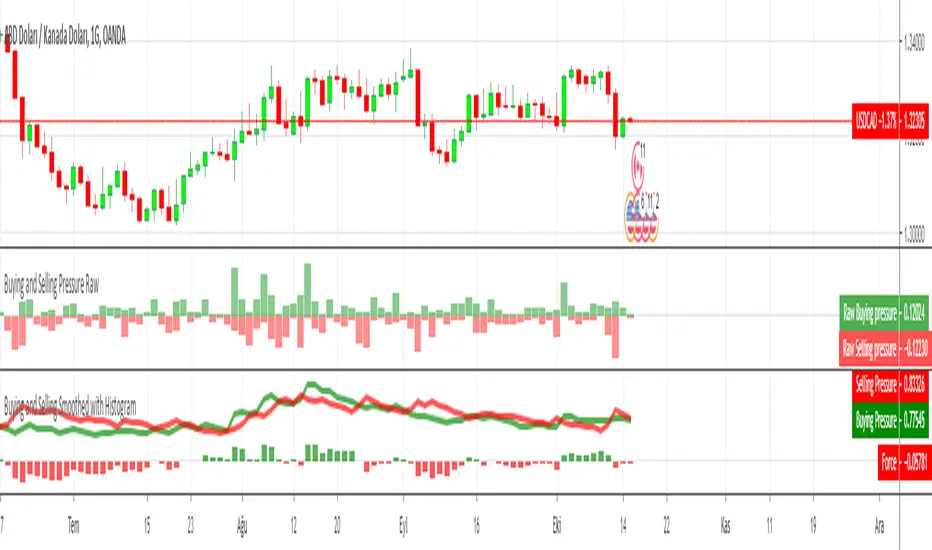
Buying and Selling Pressure RawBuying and Selling Pressure Raw
Raw Buying and selling pressure Indicator. The Raw buying and selling indication is provided in terms of a Columns.
Green bars above zero show the buying pressure and the red bars below the zero line show the selling pressure.
This presents a good visual representation of the dominating pressure.
MACD Strategy by SedkurThis gives to you buy-sell signal with MACD histogram value.
Use "Fast and Slow length" and "Buy or Sell Histogram Value" inputs to take less or more signal.

Brandon BollSecond day at Pinescript and I am attempting to tweak the Bollinger Bands directed strategy to send alerts to Zignaly in order to automate long buy/sells.
I've left in the short script though for completeness.
The buy and sell instructions work perfectly but I don't know how to do a cancel order alert (as included in the original strategy)

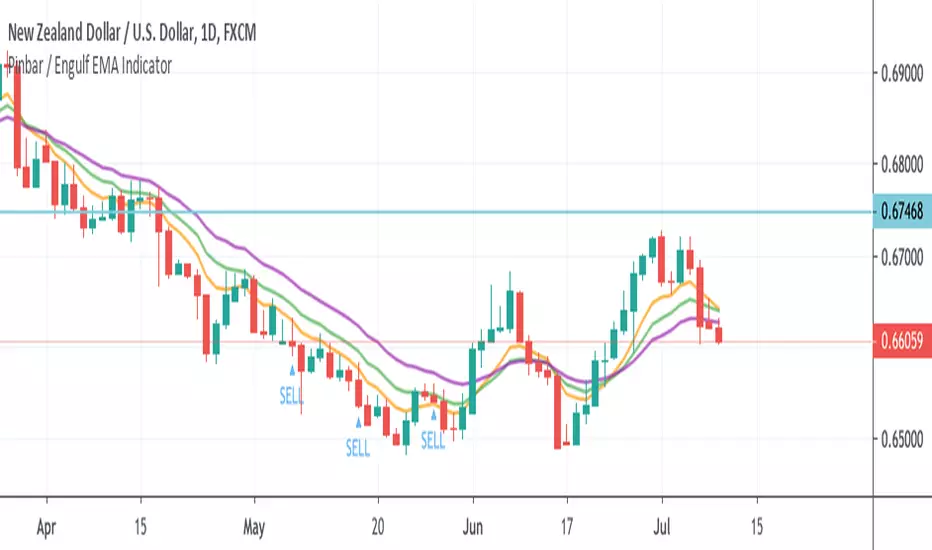
Pinbar / Engulf EMA IndicatorThis indicator is built based on the video by ForexSignals TV (no association on my part with them), published on July 5th, 2019 titled "SIMPLE & PROFITABLE Trend-following Forex Trading Strategy!"
The basic premiss is to use the 8,13,21 EMAs, make sure they have not crossed in the previous 3 bars, then look for engulfing bars or pinbars for the current direction. Meaning if the trend is up, look for bullish engulfer or pinbars, and bearish ones if the trend is down. Also, the pin must have crossed the 8EMA but not the 21EMA.
When determining to act on the signal, the video recommends only executing a buy/sell if the the current trend in the anchor chart is trending in the same direction (trending up only enter buys, trending down, only enter sells).
The script overlays a BUY or SELL tag under the bar that meets the above criteria.
Fib Divergence SystemCombo of many useful indicators which includes fib lines, time and money channels and divergence buy sell signals
Credits for source code:
Scarf, Lazybear, 100kiwi

Steroid CCI w/ Overbought & Oversold Alert//@version=2
//By Tantamount
//Channel Commodity Index (CCI) with overbought and oversold alert features! Highly configurable indicator that includes a Topography map feature, used to detect & show minute threshold crosses.
//CCI is a momentum based technical trading tool used to help determine when an asset is reaching an overbought or oversold condition and is an great alternative to RSI.
//This CCI tool comes loaded with features and is easily configurable back to standard CCI or with your own preferences.
Customize to your liking:
Simple alert signals
The full enchilada, with Topo map view!
Stand alone CCI oscillator

Multiple MACD RSI simple strategySimple strategy script I've had for a while but looks like I never published.
Although it is one of my most simple it seems to have the best profitability. It is pretty rough though. the Stoch RSI has only a little weight to the trade trigger. I'll refine it more over time or you can by all means. Basically the Stoch RSI current K line has to be OVER 40 to trigger a SELL. It has no effect on buy side.
The triggers are roughly as follows:
Year - since so many assets have gone 2x, 3x, 10x+ since 2013 having a strategy that earns a 500% return from 2013 to now isn't that good if buy-and-holding would have got you 800%. This eliminates some of that noise and makes it a little easier to quickly gauge success. So buy/sell trigger need a value of greater or equal to 2018 (default)
MACD 1 - First MACD (short) needs to indicate greater than 0 to buy or less than 0 to sell.
MACD 2 - Same as MACD1 but for second MACD set (long)
Uptrend - Latest close + high divided by last periods close + high needs to be grater than 1. So if latest is 34.30 close and 34.60 high and previous interval is 34.80 close and 34.82 high, that is 0.99 and will not trigger a buy trade.
Downtrend - Same thing but close + low and less than 1.
This script/strategy is pretty rough but if there is interest I'll polish it more since it is a pretty solid but simple strategy for most assets.

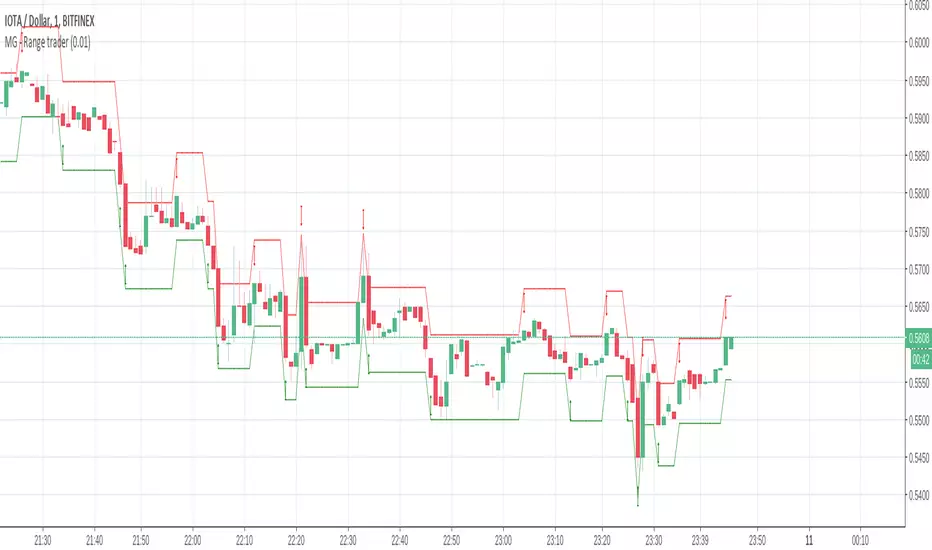
MG - Range trader - 1.0This one is a bit of an experiment..
The theory is, if you have an asset that you firmly believe will rise in the future for fundamental reasons and are happy to hold until that happens i.e. a be a position trader, you can take advantage of market volatility at the same time in a relatively safe way, so theoretically, you profit when the price goes up or down
E.g. You have $1000, an asset in which you want to become a position trader and you are happy to either make more money or more of the asset as you believe that will make you more money in the future, you could wait until a decent retracement, maybe around a good support level, then buy $500 of the asset and simply sell if it goes up by X, buy if it goes down by X. If you keep doing this, you will end up with either with more of the asset or more money. You have a sure gain either way (if you are happy to have either money or asset)
There are some considerations:
The higher the trade size, the faster profit compounds and the faster you exhaust your available buys and sells
- E.g. If asset is $100, you have $500 and you plan to buy / sell every $10 change, if the asset drops straight to $40, your last buy will be at $50, at which point, the asset is still dropping. But it you only plan to buy / sell $5 every $10 price, you will be able to buy right down to 0.
In times of strong trend, it may be better to avoid this approach altogether as there may not be so much oscillation or at least to use a small if not minimum order size.
Application:
The buy and sell triggers can be connected using autoview to convert this indicator into a range trading bot
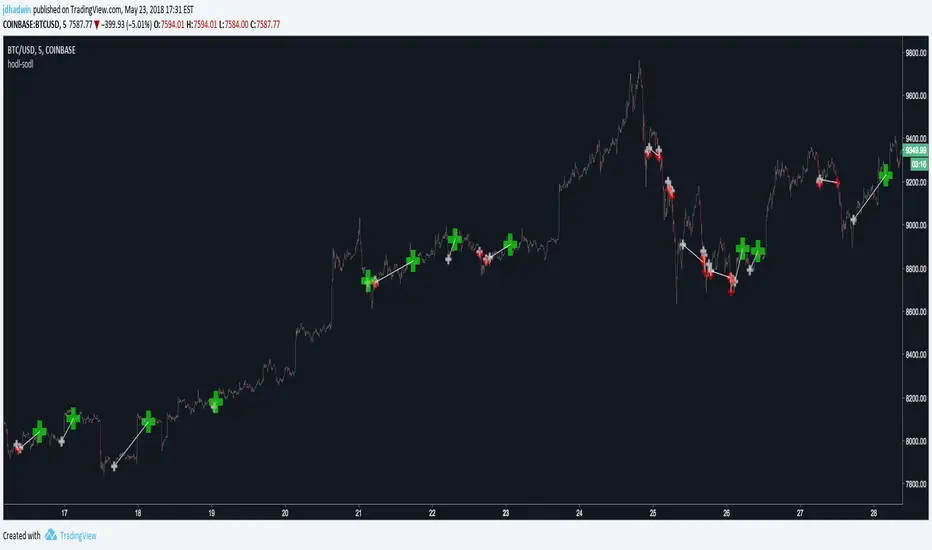
AutoView - Hodl to SodlWrite your own strategy and use Hodl to Sodl to send Alerts for when to buy & sell, and automatically plot your anticipated buys/sells to the chart. A must have for AutoView users. Requires Pine Script coding. Not compatible with "Strategy Tester" tab and "Paper Trading" tab in TradingView.
Hodl-Sodl itself is not a strategy. It is a framework for building AutoView strategies. For demonstration purposes, the image featured with this script shows an example of a very simple CCI strategy (and not a very good one), but you would presumably replace that with your own ideas. If you'd like a little help plugging in your own strategy, contact jdhadwin for custom coding.
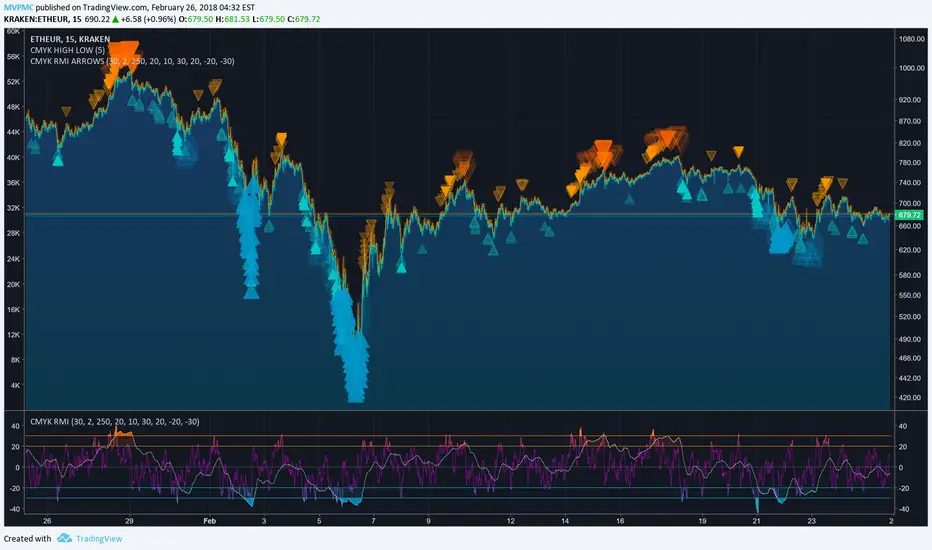
CMYK RMI ARROWS◊ Introduction
I started using this script because of its fast reaction, and good tell for buy/sell moments.
For larger timescales, the overall trend should be taken into account regarding the levels.
In the future i will update this indicator, to automatically adjust those.
This is the Overlay expansion of the Indicator Linked below.
◊ Origin
The Relative Momentum Index was developed by Roger Altman and was introduced in his article in the February, 1993 issue of Technical Analysis of Stocks & Commodities magazine.
While RSI counts up and down days from close to close, the Relative Momentum Index counts up and down days from the close relative to a close x number of days ago.
This results in an RSI that is smoother.
◊ Adjustments
CMYK color theme applied.
Four levels to indicate intensity.
Two Timescales, to overview the broader trend, and fast movements.
◊ Usage
RMI indicates overbought and oversold zones, and can be used for divergence and trend analysis.
◊ Future Prospects
Self adjusting levels, relative to an SMA trend.
Alternative RMI, which functions as an overlay.
◊ ◊ ◊ ◊ ◊ ◊ ◊ ◊ ◊ ◊ ◊ ◊ ◊ ◊ ◊ ◊ ◊ ◊ ◊ ◊ ◊ ◊ ◊ ◊ ◊ ◊ ◊ ◊ ◊ ◊ ◊ ◊ ◊ ◊ ◊ ◊ ◊ ◊ ◊ ◊ ◊ ◊ ◊ ◊ ◊ ◊ ◊ ◊ ◊ ◊ ◊ ◊ ◊ ◊ ◊ ◊ ◊ ◊ ◊ ◊ ◊ ◊ ◊ ◊ ◊ ◊ ◊ ◊ ◊ ◊ ◊ ◊ ◊ ◊ ◊ ◊ ◊ ◊ ◊ ◊ ◊ ◊ ◊ ◊ ◊ ◊ ◊ ◊ ◊ ◊ ◊ ◊ ◊ ◊ ◊ ◊ ◊ ◊ ◊ ◊ ◊ ◊ ◊ ◊ ◊ ◊
░▒▓█ CMYK ◊ RMI █▓▒░
Gunbot MACDgenOk this is just some strat based on MACD, checking for a few conditions until giving buy/sell signals to Gunbot via alerts.
It is generalized but if you want to go play with the values. I will continue to develop this further and am happy to receive feedback.
Notations are coming.
Usage notes:
-ONLY use this with TV_GAIN: 0.6 because on downtrends it is supposed to double up to pull down the average bought price!
-Use "buying condition" and "selling condition" for alerts, trigger on close and I suggest you use 3 min intervals but try what looks good to you
-Use this on pairs that are curvy and have atleast 0.6% gain between buy/sell triggers. This is also general advise when you want to take microprofits.
-Don't be confused with sell arrows, it will only trigger the bot sell on gain when you've set TV_GAIN

Stock Market Trend Analysis Trading System 101 (by ChartArt)This is a very simple trading system which is measuring the core of uptrends and downtrends using three basic elements: Close price, HL2 price, Pivot price.
Depending if the uptrend or downtrend is strong, the buy/sell signals are shown in different colors. The stronger trends are in brighter colors (lime and fuchsia). If the trend just fully changed direction from uptrend to downtrend (or vice versa), there is a background color highlight in the color of the new trend direction.
The trend detection should work best on monthly charts. I have created this in under an hour. My goal was to use the least amount of rules possible, therefore there are many false signals and the code is quite lazy.
You can lose all your money if you rely on these buy/sell signals!

Scalp EA for 15 Minute Timeframes and HigherSo I have written this indicator based upon the percentages of the High and the Low of the candlestick with respect to the open price. This indicator by no means tries to find top's and bottom's;however, it does find good opportunities for 5-20 pips reversals or continuations. The signal is provided without delay and should only be based upon the closing of the candle. For example, at open- the indicator will tell you "buy, sell, or remain flat" but you should only buy or sell when the candle has completely closed.
Choose whether to use it for scalps, or to set up larger trades with bigger time frames and support or resistance zones.
*Warning*- This is untested and will remain untested due my unavailability.
Reason behind the coding: As I trader, I like to think that I am always "buying low and selling high"or "selling high and buying low". Throughout my trading experiences, I can tell you that I have done the opposite many times. This indicator helps me in finding opportunities as I have written it to always Sell at the closing price of a green candle and always to buy at the close of a red candle. The indicator makes the attempt to Sell High and Buy Low.

Green AverageGA (Green Average) is used as a bias and context tool. The indicator is not an entry signal by itself,
but answers the question: Should I even be looking for longs or shorts right now?
1. What the indicator shows
• BP (green line): buying pressure – how much of the upward movement is driven by green
candles.
• SP (red line): selling pressure – how much of the downward movement is driven by red candles.
• GA % (box): proportion of candles that are green (frequency / flow).
2. Quick market read (3 seconds)
• BP above SP → bullish bias
• SP above BP → bearish bias
• Lines close together → chop / uncertain market
• Both lines spiking simultaneously → high energy / volatility
3. Core rules
• Bias first, entry second: trade only in the direction of dominant pressure.
• Crossovers indicate regime shifts, not automatic entries.
• GA % is context, not a buy/sell signal.
4. Entry models
A) Trend continuation
BP > SP with clear separation. Wait for a pullback (VWAP, support, MA) and enter on trend
resumption.
B) Regime shift after crossover
After a BP/SP crossover, wait for price confirmation (15m swing break or VWAP reclaim).
C) Mean reversion (range)
Only when both lines are low and cross frequently. Small targets, defensive sizing.
5. Common mistakes
• Taking every crossover as a trade
• Oversizing when lines are glued together
• Assuming high GA % guarantees upside
6. Day types
• Trend day: BP dominates, GA % often above 52–55.
• Chop day: BP ≈ SP, GA % around 50.
• Distribution: GA % high but SP takes control.
7. Default settings (ETH 5m)
• Window N = 24 (≈ 2 hours)
• BP/SP smoothing = 3
• GA used together with VWAP and price structure

VIX Term Structure Pro [v7.0 Enhanced]# VIX Term Structure Pro v7.0
[! (img.shields.io)](www.tradingview.com)
[! (img.shields.io)](www.tradingview.com)
[! (img.shields.io)](LICENSE)
**Professional VIX-based Market Sentiment & Timing Indicator**
专业的 VIX 市场情绪与择时指标
---
## 🌟 Overview / 概述
VIX Term Structure Pro is an advanced multi-factor market timing indicator that analyzes the VIX futures term structure, volatility regime, and market breadth to generate actionable buy/sell signals.
VIX Term Structure Pro 是一款高级多因子市场择时指标,通过分析 VIX 期货期限结构、波动率区间及市场广度,生成可操作的买卖信号。
---
## 🚀 Key Features / 核心功能
### 📊 Multi-Factor Scoring System / 多因子评分系统
- **Term Structure Z-Score**: Measures deviation from historical mean / 期限结构 Z 分数:衡量与历史均值的偏离
- **VIX/VX1 Basis**: Spot premium detection for panic signals / VIX 现货溢价:恐慌信号检测
- **Contango Analysis**: Futures curve shape insights / 期货升水分析
- **SKEW Integration**: Options skew for tail risk / SKEW 整合:尾部风险监测
- **Put/Call Ratio**: Sentiment extremes / 看跌/看涨比率:情绪极端
- **VVIX Support**: Volatility of volatility (optional) / VVIX 支持:波动率的波动率
### 🎯 Three-Tier Signal System / 三级信号系统
| Signal | Score | Description |
|--------|-------|-------------|
| 🚨 **CRASH BUY** | ≥ 6 | Extreme panic, rare opportunity / 极端恐慌,罕见机会 |
| 🟢 **STRONG BUY** | ≥ 5 | Multi-factor confluence / 多因子共振 |
| 🟡 **BUY DIP** | ≥ 4 | Accumulate on weakness / 逢低吸纳 |
| 🟠 **SELL/HEDGE** | ≤ -2 | Consider reducing risk / 考虑减仓对冲 |
| 🔴 **STRONG SELL** | ≤ -5 | Strong bearish signals / 强烈看跌信号 |
| 🔥 **EUPHORIA SELL** | ≤ -6 | Extreme greed, sell signal / 极度贪婪,卖出信号 |
### 📈 Dashboard Indicators / 仪表盘指标解读
| Indicator | Bullish 🟢 | Bearish 🔴 |
|-----------|------------|------------|
| Overall Bias | STRONG BUY / BUY DIP | STRONG SELL / SELL/HEDGE |
| AI Score | ≥ 5 (Extreme Fear) | ≤ -5 (Extreme Greed) |
| Market Trend | 🟢SPX 🟢NDX (Above MA200) | 🔴SPX 🔴NDX (Below MA200) |
| VIX Regime | LOW VOL (<15) | HIGH VOL (>25) |
| Term Struct Z | < -2.0 (Panic) | > 2.0 (Complacency) |
---
## ⚙️ Configuration / 配置选项
### 📡 Data Sources / 数据源
- **VIX Symbol**: Default `CBOE:VIX` (Alternative: `TVC:VIX`)
- **Put/Call Ratio**: Default `INDEX:CPCI` (Index P/C)
- **Timeframe**: Daily (stable) or Chart (real-time)
### ⚠️ Strategy Mode / 策略模式
- **High (Scalping)**: Sensitive, for short-term trades / 高敏感,短线
- **Normal (Swing)**: Balanced approach / 平衡模式
- **Low (Trend/Safe)**: Conservative, trend-following / 保守,趋势跟踪
### 🔬 Backtest Mode / 回测模式
- **OFF (Real-time)**: Shows current day data, suitable for live monitoring / 显示当日数据,适合实盘监控
- **ON (Historical)**: Uses only confirmed data, avoids look-ahead bias / 仅使用已确认数据,避免未来函数
---
## 📖 Usage Guide / 使用指南
### Best Practices / 最佳实践
1. **Apply to SPX/SPY/QQQ daily charts** for optimal signal accuracy
在 SPX/SPY/QQQ 日线图上使用,信号准确度最佳
2. **Wait for next trading day** to execute signals (signals trigger on daily close)
信号触发后在下一交易日执行(信号基于日线收盘)
3. **Use in conjunction with price action** for confirmation
结合价格走势确认信号
4. **Enable Market Trend Filter** (MA200) for safer entries in uncertain markets
开启趋势过滤(MA200)以在不确定市场中更安全入场
### Signal Interpretation / 信号解读
```
🚨 CRASH BUY (Score ≥ 6)
→ Rare extreme panic event
→ Historical average return: significant positive over 2 months
→ Consider aggressive positioning
🟢 STRONG BUY (Score ≥ 5)
→ Multiple indicators align
→ Historical average return: positive over 1 month
→ Consider building positions
🟡 BUY DIP (Score ≥ 4)
→ Moderate fear detected
→ Suitable for adding to existing positions
→ Filtered out in bear markets if Trend Filter is ON
```
---
## 📊 Historical Statistics / 历史统计
The indicator tracks signal frequency and average subsequent returns:
- **CRASH BUY**: 40-day return period (~2 months)
- **STRONG BUY**: 20-day return period (~1 month)
- **BUY DIP**: 10-day return period (~2 weeks)
指标追踪信号频率和后续平均收益,可在仪表盘中查看历史统计。
---
## 🔔 Alerts / 警报
Built-in alert conditions with cooldown mechanism to prevent spam:
| Alert | Condition |
|-------|-----------|
| Crash Buy Alert | Score ≥ 6, extreme panic |
| Strong Buy Alert | Score ≥ 5, multi-factor confluence |
| Buy Dip Alert | Score ≥ threshold |
| Euphoria Sell Alert | Score ≤ -6, extreme greed |
| Strong Sell Alert | Score ≤ -5 |
| VIX Basis Panic | VIX spot premium spike |
---
## 📋 Changelog / 更新日志
### v7.0 (Current)
- ✨ Three-tier buy/sell signal system
- 📊 Signal statistics with average return tracking
- 🔬 Backtest Mode toggle for historical testing
- 🎨 Configurable ±1 Z-Score reference lines
- ⚡ Modular scoring functions
- 🛡️ Dual index trend display (SPX + NDX)
- 📱 Compact & Full dashboard modes
---
## ⚠️ Disclaimer / 免责声明
**English:**
This indicator is for educational and informational purposes only. It does not constitute financial advice. Past performance does not guarantee future results. Always do your own research and consider your risk tolerance before trading.
**中文:**
本指标仅供教育和信息参考,不构成投资建议。过往表现不代表未来收益。交易前请自行研究并评估风险承受能力。
---
## 📄 License / 许可证
MIT License - Feel free to use, modify, and share.
---
## 🤝 Contributing / 贡献
Issues and pull requests are welcome!
欢迎提交问题和贡献代码!
---
**Made with ❤️ for the trading community**
**为交易社区用心打造**

Momentum by Trading BiZonesSqueeze Momentum Indicator with EMA
Overview
The Squeeze Momentum Indicator with EMA is a powerful technical analysis tool that combines the original Squeeze Momentum concept with an Exponential Moving Average (EMA) overlay. This enhanced version helps traders identify market momentum, volatility contractions (squeezes), and potential trend reversals with greater precision.
Core Concept
The indicator operates on the principle of volatility contraction and expansion:
Squeeze Phase: When Bollinger Bands move inside the Keltner Channel, indicating low volatility and potential energy buildup
Expansion Phase: When momentum breaks out of the squeeze, signaling potential directional moves
Key Components
1. Squeeze Momentum Calculation
Formula: Momentum = Linear Regression(Close - Average Price)
Where Average Price = (Highest High + Lowest Low + SMA(Close)) / 3
Visualization: Histogram bars showing positive (green) and negative (red) momentum
Zero Line: Represents equilibrium point between buyers and sellers
2. EMA Overlay
Purpose: Smooths momentum values to identify underlying trends
Customization:
Adjustable period (default: 20)
Toggle on/off display
Customizable color and line thickness
Cross Signals: Buy/sell signals when momentum crosses above/below EMA
3. Volatility Bands
Bollinger Bands (20-period, 2 standard deviations)
Keltner Channels (20-period, 1.5 ATR multiplier)
Squeeze Detection: Visual background shading when BB are inside KC
Trading Signals
Buy Signals (Green Upward Triangle)
Momentum histogram crosses ABOVE EMA line
Occurs during or after squeeze release
Confirmed by expanding histogram bars
Sell Signals (Red Downward Triangle)
Momentum histogram crosses BELOW EMA line
Often precedes market downturns
Watch for increasing negative momentum
Squeeze Warnings (Gray Background)
Market in low volatility state
Prepare for potential breakout
Direction indicated by momentum bias
Indicator Settings
Main Parameters
Length: Period for calculations (default: 20)
Show EMA: Toggle EMA visibility
EMA Period: Smoothing period for EMA
Visual Settings
Histogram color-coding based on momentum direction
EMA line color and thickness
Signal marker size and visibility
Squeeze zone background display
Practical Applications
Trend Identification
Uptrend: Consistently positive momentum with EMA support
Downtrend: Consistently negative momentum with EMA resistance
Range-bound: Oscillating around zero line
Entry/Exit Points
Conservative Entry: Wait for squeeze release + EMA crossover
Aggressive Entry: Anticipate breakout during squeeze
Exit: Opposite crossover or momentum divergence
Risk Management
Use squeeze zones as warning periods
EMA crossovers as confirmation signals
Combine with support/resistance levels
Advanced Interpretation
Momentum Strength
Strong Bullish: Tall green bars above EMA
Weak Bullish: Short green bars near EMA
Strong Bearish: Tall red bars below EMA
Weak Bearish: Short red bars near EMA
Divergence Detection
Price makes higher high, momentum makes lower high → Bearish divergence
Price makes lower low, momentum makes higher low → Bullish divergence
Squeeze Characteristics
Long squeezes: More potential energy
Frequent squeezes: Choppy market conditions
No squeezes: High volatility, trending markets
Recommended Timeframes
Scalping: 1-15 minute charts
Day Trading: 15-minute to 4-hour charts
Swing Trading: 4-hour to daily charts
Position Trading: Daily to weekly charts
Best Practices
Confirmation
Use with volume indicators
Check higher timeframe direction
Wait for candle close confirmation
Filtering Signals
Ignore signals during extreme volatility
Require minimum bar size for crossovers
Consider market context (news, sessions)
Combination Suggestions
With RSI: Confirm overbought/oversold conditions
With Volume Profile: Identify high-volume nodes
With Support/Resistance: Key level reactions
With Trend Lines: Breakout confirmations
Limitations
Lagging indicator (based on past data)
Works best in trending markets
May give false signals in ranging markets
Requires proper risk management
Conclusion
The Squeeze Momentum Indicator with EMA provides a comprehensive view of market dynamics by combining volatility analysis, momentum measurement, and trend smoothing. Its visual clarity and customizable parameters make it suitable for traders of all experience levels seeking to identify high-probability trading opportunities during volatility contractions and expansions.

BTC DCA Risk Metric StrategyBTC DCA Risk Strategy - Automated Dollar Cost Averaging with 3Commas Integration
Overview
This strategy combines the proven Oakley Wood Risk Metric with an intelligent tiered Dollar Cost Averaging (DCA) system, designed to help traders systematically accumulate Bitcoin during periods of low risk and take profits during high-risk conditions.
Key Features
📊 Multi-Component Risk Assessment
4-Year SMA Deviation: Measures Bitcoin's distance from its long-term mean
20-Week MA Analysis: Tracks medium-term momentum shifts
50-Day/50-Week MA Ratio: Captures short-to-medium term trend strength
All metrics are normalized by time to account for Bitcoin's maturing market dynamics
💰 3-Tier DCA Buy System
Level 1 (Low Risk): Conservative entry with base allocation
Level 2 (Lower Risk): Increased allocation as opportunity improves
Level 3 (Extreme Low Risk): Maximum allocation during rare buying opportunities
Buys execute every bar while risk remains below thresholds, enabling true DCA accumulation
📈 Progressive Profit Taking
Sell Level 1: Take initial profits as risk increases
Sell Level 2: Scale out further positions during elevated risk
Sell Level 3: Final exit during extreme market conditions
Sell levels automatically reset when new buy signals occur, allowing flexible re-entry
🤖 3Commas Integration
Fully automated webhook alerts for Custom Signal Bots
JSON payloads formatted per 3Commas API specifications
Supports multiple exchanges (Binance, Coinbase, Kraken, Gemini, Bybit)
Configurable quote currency (USD, USDT, BUSD)
How It Works
The strategy calculates a composite risk metric (0-1 scale):
0.0-0.2: Extreme buying opportunity (green zone)
0.2-0.5: Favorable accumulation range (yellow zone)
0.5-0.8: Neutral to cautious territory (orange zone)
0.8-1.0+: High risk, profit-taking zone (red zone)
Buy Logic: As risk decreases, position sizes increase automatically. If risk drops from L1 to L3 threshold, the strategy combines all three tier allocations for maximum exposure.
Sell Logic: Sequential profit-taking ensures you capture gains progressively. The system won't advance to Sell L2 until L1 completes, preventing premature full exits.
Configuration
Risk Metric Parameters:
All calculations use Bitcoin price data (any BTC chart works)
Time-normalized formulas adapt to market maturity
No manual parameter tuning required
Buy Settings:
Set risk thresholds for each tier (default: 0.20, 0.10, 0.00)
Define dollar amounts per tier (default: $10, $15, $20)
Fully customizable to your risk tolerance and capital
Sell Settings:
Configure risk thresholds for profit-taking (default: 1.00, 1.50, 2.00)
Set percentage of position to sell at each level (default: 25%, 35%, 40%)
3Commas Setup:
Create a Custom Signal Bot in 3Commas
Copy Bot UUID and Secret Token into strategy inputs
Enable 3Commas Alerts checkbox
Create TradingView alert: Condition → "alert() function calls only", Webhook → api.3commas.io
Backtesting Results
Strengths:
Systematically buys dips without emotion
Averages down during extended bear markets
Captures explosive bull run profits through tiered exits
Pyramiding (1000 max orders) allows true DCA behavior
Considerations:
Requires sufficient capital for multiple buys during prolonged downtrends
Backtest on Daily timeframe for most reliable signals
Past performance does not guarantee future results
Visual Design
The indicator pane displays:
Color-coded risk metric line: Changes from white→red→orange→yellow→green as risk decreases
Background zones: Green (buy), yellow (hold), red (sell) areas
Dashed threshold lines: Clear visual markers for each buy/sell level
Entry/Exit labels: Green buy labels and orange/red sell labels mark all trades
Credits
Original Risk Metric: Oakley Wood
Strategy Development & 3Commas Integration: Claude AI (Anthropic)
Modifications: pommesUNDwurst
Disclaimer
This strategy is for educational and informational purposes only. Cryptocurrency trading carries substantial risk of loss. Always conduct your own research and never invest more than you can afford to lose. The authors are not financial advisors and assume no responsibility for trading decisions made using this tool.

Indicator ***TuYa*** V8.2 – HH/HL MTF + Peak Mid ZoneIndicator TuYa V8.0 – HH/HL MTF + Peak Mid Zone
TuYa V8.0 combines multi-timeframe market structure with a Peak Reaction midline to create clean, rule-based reversal and trend entries – designed primarily for 1-minute execution with 1-hour bias.
🧠 Core Concept
This indicator fuses three ideas:
HTF Peak Reaction Midline (1H)
Uses a Peak Reaction style logic on the higher timeframe (HTF, default: 1H).
Identifies a reaction high and reaction low, then calculates their midpoint → the Peak Mid Zone.
This midline acts as a dynamic sentiment divider (above = premium / below = discount).
Multi-Timeframe HH/HL/LH/LL Structure
HTF structure (1H): detects HH, HL, LH, LL using pivot highs/lows.
LTF structure (1m): detects HH, HL, LH, LL on the execution timeframe (chart TF, intended for 1m).
HTF → LTF Confirmation Window
After a 1H structure event (HH, HL, LL, LH), the indicator opens a confirmation window of up to N LTF candles (default: 10 x 1m bars).
Within that window, the required 1m structure event must occur to confirm an entry.
🎯 Signal Logic
All entries are generated on the LTF (e.g. 1m chart), using HTF (e.g. 1H) bias + Peak Mid Zone:
1️⃣ Price ABOVE Peak Mid (Bullish premium zone)
Reversal SELL
HTF: HH (Higher High)
Within N 1m bars: LTF HH
→ SELL signal (fading HTF strength near premium)
Trend/Bullish BUY
HTF: HL (Higher Low)
Within N 1m bars: LTF LL
→ BUY signal (buying dips in an uptrend above midline)
2️⃣ Price BELOW Peak Mid (Bearish discount zone)
Reversal BUY
HTF: LL (Lower Low)
Within N 1m bars: LTF LL
→ BUY signal (catching potential reversal from discount)
Trend/Bearish SELL
HTF: LH (Lower High)
Within N 1m bars: LTF HH
→ SELL signal (shorting strength in a downtrend below midline)
Signals are plotted as small BUY/SELL triangles on the chart and exposed via alert conditions.
🧾 Filters & Options
⏳ HTF → LTF Delay Window
Input: “Max 1m bars after HTF trigger” (default: 10)
After a 1H HH/HL/LL/LH event, the indicator waits up to N LTF candles for the matching 1m structure pattern.
If no match occurs within the window, no signal is generated.
📉 RSI No-Trade Zone (HTF)
Toggle: Use RSI no-trade zone
Inputs:
RSI Length (HTF)
No-trade lower bound (default 45)
No-trade upper bound (default 65)
If HTF RSI is inside the defined band (e.g. 45–65), signals are blocked (no-trade regime), helping to avoid noisy mid-range conditions.
You can turn this filter ON/OFF and adjust the band dynamically.
🧱 5m OB / Direction Filter (Optional)
Toggle: Use 5m OB direction filter
Timeframe: Configurable (default: 5m).
Uses a simple directional proxy on the OB timeframe:
For BUY signals → require a bullish candle on OB timeframe.
For SELL signals → require a bearish candle on OB timeframe.
When enabled, this adds an extra layer of confluence by aligning entries with the short-term directional context.
⚙️ Key Inputs (Summary)
Timeframes
HTF (Peak Reaction & Structure): default 60 (1H)
Peak Reaction
Lookback bars (HTF)
ATR multiplier for zones
Show/Hide Peak Mid line
Structure
Pivot left/right bars (for HH/HL/LH/LL swings)
Toggle structure labels (HTF & LTF)
Confirmation
Max LTF bars after HTF trigger (default 10, fully configurable)
RSI Filter
Use filter (on/off)
RSI length
No-trade range (low/high)
5m OB Filter
Use filter (on/off)
OB timeframe (default 5m)
📡 Alerts & Automation
The script includes alertconditions for both BUY and SELL signals, with JSON-formatted alert messages suitable for routing to external bridges (e.g. bots, MT5/MT4, n8n, etc.).
Each alert includes:
Symbol
Side (BUY / SELL)
Price / Entry
SL & TP placeholders (from hidden plots, ready to be wired to your own logic)
Time
Performance tag
CommentCode (for strategy/type tagging on the receiver side)
You can attach these alerts to a webhook and let your execution engine handle SL/TP and order management.
📌 How to Use
Attach the indicator to a 1-minute chart.
Set HTF timeframe to 60 (or your preferred higher timeframe).
Optionally enable:
RSI regime filter
5m OB direction filter
Watch for:
Price relative to the Peak Mid line
BUY/SELL triangles that respect HTF structure + LTF confirmation + filters.
For automation, create alerts using the built-in conditions and your preferred JSON alert template.
⚠️ Disclaimer
This tool is for educational and informational purposes only.
It is not financial advice and does not guarantee profits. Always test thoroughly in replay / paper trading before using with live funds, and trade at your own risk.

Momentum Reversal / Dip Buyer [Score Based]Strategy Overview
Momentum Reversal / Dip Buyer is a quantitative reversal engine designed to fade stretched moves and buy dips / sell rallies when multiple momentum and context factors line up. It’s built for liquid instruments especially for ticker CME_MINI:ES1! and works best on intraday timeframes like the 5-minute or 1-minute chart.
Core Logic
This strategy builds a composite Momentum Score by combining:
Price Location: Relative to 100 SMA, 1000 EMA, and VWAP (trend / regime filter).
RSI: Overbought/oversold and mid-zone strength.
VWMO (Volume-Weighted Momentum): Direction and strength of volume-weighted price drift.
ADX: Trend strength filter (high vs low trend environment).
Full Stoch (%K): Short-term exhaustion and mean-reversion context.
CCI: Overbought/oversold turns (key trigger).
MFI: Volume-confirmed buying/selling pressure.
ATR Regime: High vs low volatility environment.
Cumulative Delta: Whether net aggressor flow is rising or falling.
From this, a single Momentum Score is computed each bar:
Longs: Taken when the score is depressed (scoreLow) and CCI crosses up from oversold.
Shorts: Taken when the score is elevated (scoreHigh) and CCI crosses down from overbought.
Risk Management & Trade Logic
Max Daily Trades: Hard cap on entries per day.
Hard Stop: Fixed % stop based on entry price.
Profit Target: Target ATR Multiplier × main ATR from entry.
Breakeven Logic: Optional; moves stop to breakeven (plus optional offset) after price moves a configurable multiple of the main ATR in your favor.
Trailing Stop (Separate ATR): Optional; uses its own ATR length and ATR-based trigger and distance. This lets you run slower ATR for targets while using a tighter, more reactive ATR for the trail.
Session Control
Trading Window: Optional session filter (e.g., 09:30–16:00). Entries are only allowed inside the defined window.
Force Flat at Session End: Option to automatically close all open positions when the session ends.
Visuals
The script plots entry arrows and a compact dashboard displaying: current Momentum Score, daily trade usage, and CCI status.
Disclaimer:
This script is for educational and research purposes only and is not financial advice. Past performance does not guarantee future results. Always forward-test and adjust parameters to your own risk tolerance and market.
Shoutout and all credit goes to AuclairsCapital for building the base foundation of this strategy on ThinkScript
